Weblogic - Working with Work Managers middleware snippets
In this post, we look at how to configure work managers in order to prioritize the execution of an application's work. WebLogic Server prioritizes work and allocates threads based on an execution model that takes into account administrator-defined parameters and actual run-time performance and throughput. Based on the defined parameters and by monitoring actual run-time performance, WebLogic Server optimizes the performance of an application in order to maintain service-level agreements. We define the rules and constraints for the application by defining work managers and applying them to specific application components. We start this post with a high-level overview of WebLogic's internal architecture, and end this post by giving an example of how to apply work managers to application components by using adeployment plan.
Once an execute thread invokes the target component of the request, that execute thread will process the entire request. A single execute thread basically spans the servlet, EJB, and JDBC components in the application container, i.e., the call to the servlet, its call to a method on an EJB, and the EJB's use of JDBC to query a database will all occur within the same execute thread. During the execution of a request, the execute thread will be unavailable to process any other requests until the request processing code completes successfully or throws an exception. This is an extremely important point to recognize. If the application code blocks the execute thread for an extended period of time, the server will not be able to use that thread to process other requests coming into the execute queue. While WebLogic does some basic sanity checks during the execution of any request (for example, checking the transaction time-out before dispatching an EJB method invocation), it is generally not possible for the server to tell the execute thread to abort the processing of a request.
If the application gets into a state where every execute thread is blocked for an extended period of time, the server will either become non-responsive (for requests targeted to that execute queue) or have to spawn additional execute threads to try to cope with the situation. Although the listen threads and the socket muxer are able to accept new requests from clients and place them into the execute queue, no execute threads will be available to process the request and return the response to the client unless the server is able to spawn new execute threads. Of course, spawning new threads that end up blocking does not improve the overall situation.
When long-running requests cause the execute threads to block, the incoming requests will start to back up in the execute queue. Even if the condition causing the execute threads to block goes away, it is very likely that the execute queue will end up with a relatively large number of messages. This not only will cause degradations in response time but also may cause users to cancel their requests (by clicking the stop button on their browsers) and to resubmit them. Typically, this will only make the situation worse because WebLogic processes every message on the execute queue in first-in-first-out order. In certain conditions (for example, reading HTTP POST data associated with an application request), WebLogic will detect that the client is no longer waiting for the response and will short-circuit the request processing. Other conditions, though, may cause WebLogic to process the request even if the client is no longer waiting for the response. Fortunately, WebLogic provides a mechanism to limit the number of requests it will accept to prevent this execute queue overload condition.
WebLogic Server maintains three groups of threads for the self-tuning thread pool:
The self-tuning thread pool does not consider the self-tuning thread pool size limit when creating a new standby thread to process incoming work requests for a Work Manager to satisfy its allocated minimum threads constraint. This is due to the importance of allocating threads for processing work requests for Work Managers with minimum threads constraints, which are designed to be used to avoid server-to-server deadlocks. As a result, the maximum possible number of threads maintained by the self-tuning thread pool is the sum of the configured self-tuning thread pool size limit and the sum of the values for all minimum threads constraints configured in the WebLogic Server instance, assuming a worst-case scenario where the configured number of threads are allocated to all configured minimum threads constraints.
Maximum thread constraints are useful in a number of situations. For example, if a particular type of request requires a database connection, we might want to set a maximum thread constraint to a value equal to the maximum number of database connections available to our application so that execute threads will not block waiting for a connection to be available. This example is such a common use case that the maximum thread constraint supports either specifying a numeric value or the name of a WebLogic–defined data source. In the latter case, the maximum thread constraint value changes as the maximum size of the data source's connection pool changes.
The minimum thread constraint has nothing to do with the minimum size of the execute thread pool. Instead, it allows us to ensure that the server will have a certain number of threads available for processing requests associated with work managers using this constraint. This is only useful to prevent deadlocks in certain server-to-server callback scenarios. Imagine that Application A runs on Managed Server 1 and Application B runs on Managed Server 2. If Application A makes an EJB call to Application B and Application B calls back to Application A (or any other application running on Managed Server 1) while processing the EJB call, it is possible to deadlock the two managed servers. If all of Managed Server 1's threads are waiting on the EJB call's response, Managed Server 1 will not have any threads available to process the callback requests and the two servers will deadlock waiting on each other. To prevent this deadlock situation, we might assign the callback requests from Application B a higher fair share than the calls generating the EJB calls to Application B. We might also add a minimum threads constraint for the callbacks to ensure that some threads will always be available for processing callbacks.
Capacity constraints allow us to specify the maximum number of requests a server will accept. The capacity constraint gives us a mechanism to prevent the execute queue overload condition. When determining capacity, the server counts all requests currently executing on an execute thread and all requests waiting in the execute queue. When a capacity constraint is reached, the server takes overload protective action; for example, by returning an HTTP 503 response to indicate that the server is too busy or returning a RemoteException for RMI calls to allow the request to fail over to another server in the cluster. WebLogic also provides a Shared Capacity for Work Managers parameter that limits the total capacity of the server.
During certain types of failure conditions, execute threads may block for extended periods of time waiting for slow back-end systems or TCP/IP time-outs in the case of machine or network failures. These conditions can cause execute threads to block for minutes at a time. If the server's incoming request load is high enough, all available execute threads will be blocked and the server will create more execute threads in an attempt to continue doing useful work. Because the server does not understand the nature of the problem or the applications it is servicing, it cannot make an intelligent decision about whether creating new execute threads will in fact help. The real issue in these situations is that the server is unable to process any requests because of the waiting condition. Our first thought might be to create a maximum thread constraint to prevent the server from creating too many threads; however, this would be treating the symptom and not the root cause. The real problem is that the requests keep piling up in its execute queue. There is no point in the server accepting work if the time it will take to process that work exceeds the time for which the clients are willing to wait on the response. A better way to protect the server in these situations is to define a capacity constraint so that the server starts rejecting work when it is unable to keep up. By combining a capacity constraint with proper tuning of the stuck thread detection capability, we can protect the server from overloading itself during these types of failures.
WebLogic allows us to define work managers, request classes, and constraints at global, application or component levels. Request classes and constraints can either be shared across work managers or be exclusive to a single work manager. All applications share any request classes and constraints associated with their work manager. The only exception to this rule, is for work managers that do not specify a request class and, therefore, use the default fair share request class.
Use the Environment, Work Managers page in the WebLogic Console to define global work managers, request classes, and constraints. All globally-defined request classes and constraints are inherently shareable - whether they are defined within or outside the context of a specific global work manager. For example, if multiple work managers share the same capacity constraint, this means that the sum total of all requests across all work managers sharing the capacity constraint will never exceed the capacity value in each server instance. If multiple applications use the same global work manager that defines an exclusive capacity constraint, this means that the sum total of all requests across all applications sharing the work manager will never exceed the capacity value in each server instance.
The application artefact has the following structure
Note that if we are dealing with a application that issues long lived (daemon) work, we can set
A configuration that also includes a request class, and a capacity looks like
To apply the above work manager to application components such as EJB's servlets, we can use the
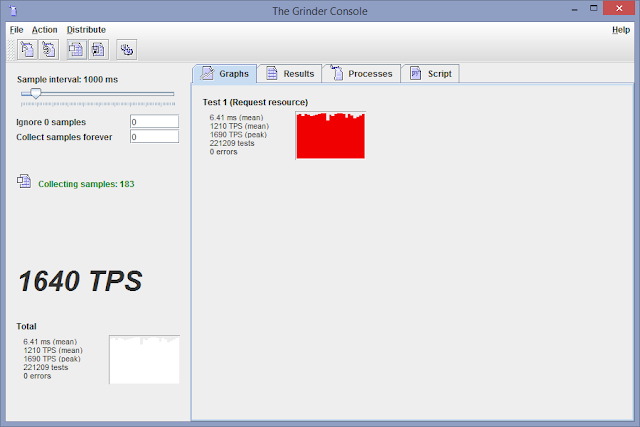
Let us put some load on the environment
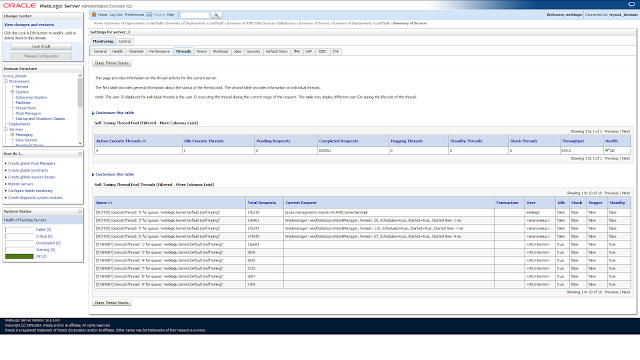
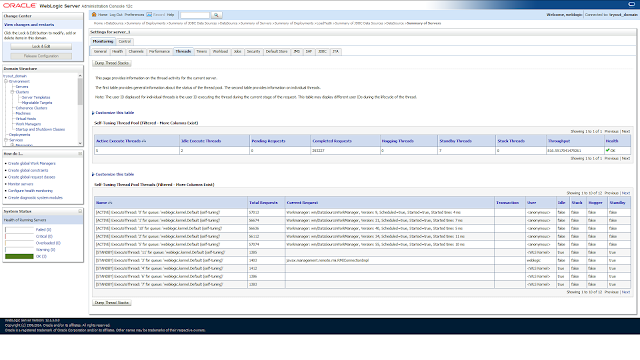
 In the WebLogic Admin Console (Server, Monitoring, Threads), we get information on the thread activity for the current server. The first table provides general information about the status of the thread pool. The second table provides information on individual threads.
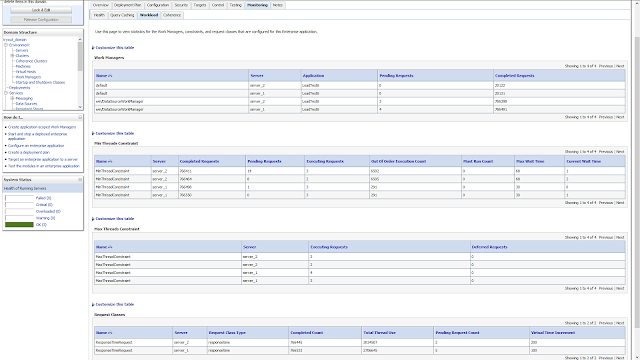
 Click Deployment, Application, Monitoring, Workload, to view statistics for the Work Managers, constraints, and request classes that are configured for this Enterprise application.
 Note that in the configuration we have only dispatched the stateless enterprise bean to the work manager. The message driven has not been dispatched and thus uses the default work manager. To see what the message driven is doing, we click JMS Server, Monitoring, Active Destinations
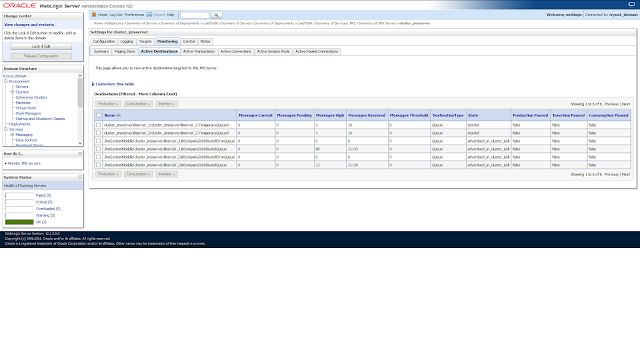 Note that the latter is later in time, hence the larger number of received messages then the completed requests for the default work manager.
Note that with pinned to thread the maximum capacity on the connection pool is ignored, i.e., the number of connections in a connection pool equals the greater of either the initial capacity or the number of connections reserved from the connection pool. Also the connection pool does not shrink as the connections are never returned to the connection pool.
With pinned to thread the number of connections in the connection pool is limited by the number of execute threads, which could get as high as 400 with the self tuning thread pool
Let us run the load test again, to see what happens with the threads and the database connections. With the load test running, we can run the above WLST script to obtain information about the thread pool
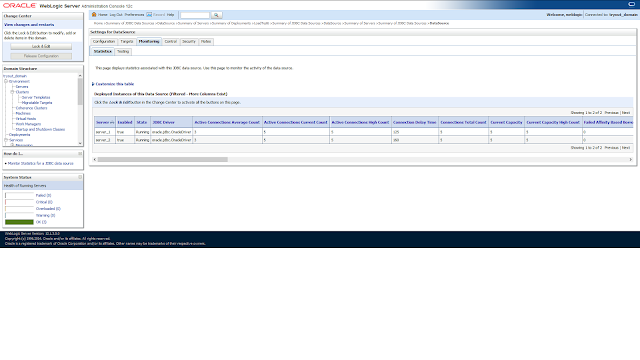
 To see how many connections are in use, click Data Sources, Monitoring, Statistics
 Note that are just as many connections as there are active threads (which also do not shrink). In the case when pinned to threads was disabled, the number of active connections was 2 to 3.
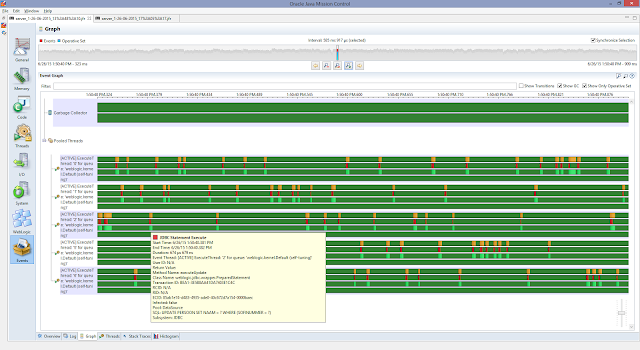
To see if it does make a difference in performance when pinned to thread is enabled, we take a look at some flight recording results. Individual (servlet, EJB, JDBC) execution times, can be obtained from the events, graph tab (top: pinned to thread disabled, bottom: pinned to thread enabled).
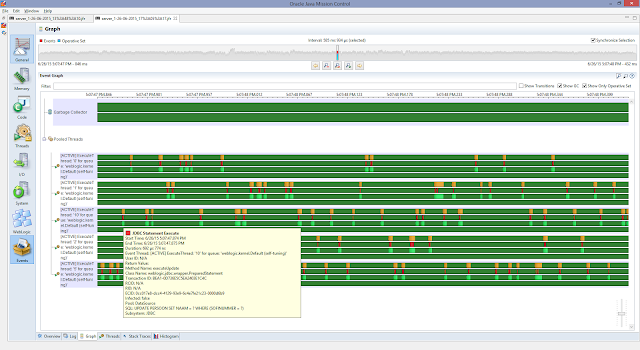 For this individual update statement the case where pinned to thread is disabled is slightly faster (disabled: 674 micro seconds, enabled: 692 micro seconds). To get aggregated results, we can use the events, histogram tab (top: pinned to thread disabled, bottom: pinned to thread enabled).
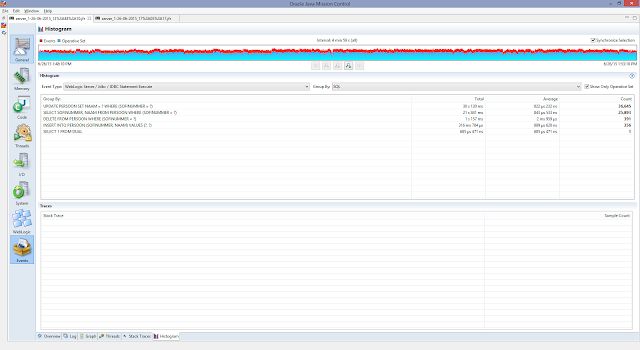
 With pinned to thread enabled the average time an update takes is 693 micro seconds, which is faster than the case where pinned to thread is disabled (822 micro seconds). Thus with pinned to thread we can get a performance enhancement, but we have to keep in mind that the connections in the connection pool are treated differently (does not shrink, which is also the case for the active execute threads). To keep things (active threads and the number of active connections) in control, it is wise to use a work manager with a maximum thread constraint.
Internal architecture
A high-level understanding of WebLogic's internal architecture is important to understand how to design, build, deploy, and debug applications that will run on WebLogic. The core components are listen threads, a socket muxer, and an execute queue with associated execute threads. When the server process starts up, it binds to one or more ports and assigns a thread to each port to listen for connection requests. Once the server accepts the connection request and establishes the connection, the server hands off control of the connection to the socket muxer, which waits for incoming requests. At a high level, the socket muxer detects an incoming request, reads the request off of the socket, and places the request along with any associated security or transaction context onto the appropriate execute queue (typically, the self-tuning execute queue). Once a request appears on the execute queue, an idle execute thread takes the request off of the queue, assumes the identity of the user who submitted the request, executes the request, returns the response to the caller, and goes back to wait for the next request.Once an execute thread invokes the target component of the request, that execute thread will process the entire request. A single execute thread basically spans the servlet, EJB, and JDBC components in the application container, i.e., the call to the servlet, its call to a method on an EJB, and the EJB's use of JDBC to query a database will all occur within the same execute thread. During the execution of a request, the execute thread will be unavailable to process any other requests until the request processing code completes successfully or throws an exception. This is an extremely important point to recognize. If the application code blocks the execute thread for an extended period of time, the server will not be able to use that thread to process other requests coming into the execute queue. While WebLogic does some basic sanity checks during the execution of any request (for example, checking the transaction time-out before dispatching an EJB method invocation), it is generally not possible for the server to tell the execute thread to abort the processing of a request.
If the application gets into a state where every execute thread is blocked for an extended period of time, the server will either become non-responsive (for requests targeted to that execute queue) or have to spawn additional execute threads to try to cope with the situation. Although the listen threads and the socket muxer are able to accept new requests from clients and place them into the execute queue, no execute threads will be available to process the request and return the response to the client unless the server is able to spawn new execute threads. Of course, spawning new threads that end up blocking does not improve the overall situation.
When long-running requests cause the execute threads to block, the incoming requests will start to back up in the execute queue. Even if the condition causing the execute threads to block goes away, it is very likely that the execute queue will end up with a relatively large number of messages. This not only will cause degradations in response time but also may cause users to cancel their requests (by clicking the stop button on their browsers) and to resubmit them. Typically, this will only make the situation worse because WebLogic processes every message on the execute queue in first-in-first-out order. In certain conditions (for example, reading HTTP POST data associated with an application request), WebLogic will detect that the client is no longer waiting for the response and will short-circuit the request processing. Other conditions, though, may cause WebLogic to process the request even if the client is no longer waiting for the response. Fortunately, WebLogic provides a mechanism to limit the number of requests it will accept to prevent this execute queue overload condition.
Self tuning thread pool
WebLogic uses a single, priority-based, self-tuning execute queue that increases and decreases the number of execute threads dynamically based on historical performance data. When the server receives a request, it determines the request class to which the request belongs, either implicitly based on the application or explicitly based on an applicable work manager configuration. Using the request class information, the server assigns the request an internal priority and places it on the execute queue, with higher priority requests go closer to the front of the queue. The closer to the front of the queue, the faster the request will be assigned to an execute thread for processing.WebLogic Server maintains three groups of threads for the self-tuning thread pool:
- Running threads: threads that are currently executing work requests submitted to Work Managers.
- Idle threads: threads that are idly waiting for a work request. Idle threads include threads that have completed their previous work requests and are waiting for new requests, as well as threads that are created by the self-tuning thread pool based on usage statistics in order to anticipate future workload.
- Standby threads: threads that are not currently processing or waiting for work requests. Standby threads do not count toward the self-tuning thread pool thread count. When the self-tuning thread pool decides to decrease the thread count based on usage statistics, threads are moved from the group of idle threads into the group of standby threads. Conversely, when the self-tuning thread pool decides to increase the thread count, it first tries to find threads in the standby thread group to move to the idle thread group. The self-tuning thread pool only creates new threads if there are not enough threads in the standby group. Threads are shut down when the number of standby threads reaches an internal maximum limit of 256. Ideally, a number of standby threads are ready if WebLogic Server needs to increase the self-tuning thread pool count occurs so that the WebLogic Server instance can avoid creating new threads at a time when workload is high. Standby threads can also be created and used to satisfy minimum threads constraints.
The self-tuning thread pool does not consider the self-tuning thread pool size limit when creating a new standby thread to process incoming work requests for a Work Manager to satisfy its allocated minimum threads constraint. This is due to the importance of allocating threads for processing work requests for Work Managers with minimum threads constraints, which are designed to be used to avoid server-to-server deadlocks. As a result, the maximum possible number of threads maintained by the self-tuning thread pool is the sum of the configured self-tuning thread pool size limit and the sum of the values for all minimum threads constraints configured in the WebLogic Server instance, assuming a worst-case scenario where the configured number of threads are allocated to all configured minimum threads constraints.
Work managers
WebLogic determines the internal priority of each request using the work managers we create to manage our applications. Work managers provide a way to partition resources across applications. To describe resource partitioning, WebLogic work managers contain four component types:- Request Class
- Minimum Threads Constraint
- Maximum Threads Constraint
- Capacity Constraint
- Fair Share Request Class - A fair share request class specifies the relative thread usage time of an application as compared to other applications running in the same instance. Imagine a managed server with two applications deployed, A and B. Application A uses a work manager with a fair share of 50 and Application B uses a work manager with a fair share of 150. When the server is receiving a steady stream of requests from both applications that exceed the number of execute threads, the server will assign Application A's requests to 25% of the available threads and Application B's requests to 75% of the available threads, assuming that requests for both applications, on average, take the same amount of time to execute. The allowable values of a fair share request class are 1 to 1000. Each application that uses a work manager that does not explicitly reference a request class gets an exclusive fair share value of 50.
- Response Time Request Class - A response time request class specifies the target response time in milliseconds. Using the previous example, imagine that Application A uses a work manager with a response time of 3000 milliseconds and Application B uses a work manager with a response time of 5000 milliseconds. When the server is receiving a steady stream of requests from both applications that exceed the number of execute threads, the server will keep the average response times of the two applications in a 3 to 5 ratio, where the actual response times will be some fraction or multiple of the response time goal.
- Context Request Class - A context request class is a compound class that maps between the context of a request and a fair share or response time request class. A context request class supports using authenticated user and group names to map to different fair share or response time request classes. For example, a certain application might assign a higher fair share request class to logged-in users, and all requests associated with the built-in user name 'anonymous' to a lower fair share request class.
Maximum thread constraints are useful in a number of situations. For example, if a particular type of request requires a database connection, we might want to set a maximum thread constraint to a value equal to the maximum number of database connections available to our application so that execute threads will not block waiting for a connection to be available. This example is such a common use case that the maximum thread constraint supports either specifying a numeric value or the name of a WebLogic–defined data source. In the latter case, the maximum thread constraint value changes as the maximum size of the data source's connection pool changes.
The minimum thread constraint has nothing to do with the minimum size of the execute thread pool. Instead, it allows us to ensure that the server will have a certain number of threads available for processing requests associated with work managers using this constraint. This is only useful to prevent deadlocks in certain server-to-server callback scenarios. Imagine that Application A runs on Managed Server 1 and Application B runs on Managed Server 2. If Application A makes an EJB call to Application B and Application B calls back to Application A (or any other application running on Managed Server 1) while processing the EJB call, it is possible to deadlock the two managed servers. If all of Managed Server 1's threads are waiting on the EJB call's response, Managed Server 1 will not have any threads available to process the callback requests and the two servers will deadlock waiting on each other. To prevent this deadlock situation, we might assign the callback requests from Application B a higher fair share than the calls generating the EJB calls to Application B. We might also add a minimum threads constraint for the callbacks to ensure that some threads will always be available for processing callbacks.
Capacity constraints allow us to specify the maximum number of requests a server will accept. The capacity constraint gives us a mechanism to prevent the execute queue overload condition. When determining capacity, the server counts all requests currently executing on an execute thread and all requests waiting in the execute queue. When a capacity constraint is reached, the server takes overload protective action; for example, by returning an HTTP 503 response to indicate that the server is too busy or returning a RemoteException for RMI calls to allow the request to fail over to another server in the cluster. WebLogic also provides a Shared Capacity for Work Managers parameter that limits the total capacity of the server.
During certain types of failure conditions, execute threads may block for extended periods of time waiting for slow back-end systems or TCP/IP time-outs in the case of machine or network failures. These conditions can cause execute threads to block for minutes at a time. If the server's incoming request load is high enough, all available execute threads will be blocked and the server will create more execute threads in an attempt to continue doing useful work. Because the server does not understand the nature of the problem or the applications it is servicing, it cannot make an intelligent decision about whether creating new execute threads will in fact help. The real issue in these situations is that the server is unable to process any requests because of the waiting condition. Our first thought might be to create a maximum thread constraint to prevent the server from creating too many threads; however, this would be treating the symptom and not the root cause. The real problem is that the requests keep piling up in its execute queue. There is no point in the server accepting work if the time it will take to process that work exceeds the time for which the clients are willing to wait on the response. A better way to protect the server in these situations is to define a capacity constraint so that the server starts rejecting work when it is unable to keep up. By combining a capacity constraint with proper tuning of the stuck thread detection capability, we can protect the server from overloading itself during these types of failures.
WebLogic allows us to define work managers, request classes, and constraints at global, application or component levels. Request classes and constraints can either be shared across work managers or be exclusive to a single work manager. All applications share any request classes and constraints associated with their work manager. The only exception to this rule, is for work managers that do not specify a request class and, therefore, use the default fair share request class.
Use the Environment, Work Managers page in the WebLogic Console to define global work managers, request classes, and constraints. All globally-defined request classes and constraints are inherently shareable - whether they are defined within or outside the context of a specific global work manager. For example, if multiple work managers share the same capacity constraint, this means that the sum total of all requests across all work managers sharing the capacity constraint will never exceed the capacity value in each server instance. If multiple applications use the same global work manager that defines an exclusive capacity constraint, this means that the sum total of all requests across all applications sharing the work manager will never exceed the capacity value in each server instance.
Example
In this example, we will use the application presented in the post WebLogic 12c in Action. Next to global work managers, WebLogic also supports defining work managers, request classes, and constraints at the application and application component level by adding definitions toweblogic-application.xml, weblogic.xml, or weblogic-ejb-jar.xml, which is the approach we will use in this example.The application artefact has the following structure
To create a deployment plan for the above artefact, we use the following
- LoadTest6.ear
- META-INF
- application.xml
- Model.jar
- META_INF
- ejb-jar.xml
- compiled classes
- Web.war
- WEB-INF
- web.xml
- compiled classes
Based on the XSD's (weblogic-application.xsd and weblogic-javaee.xsd), we can configure the work manager in the
- /loadtest6workmanager
- /app
- LoadTest6.ear
- /plan
- /META-INF
- weblogic-application.xml
- /Model.jar/META-INF
- weblogic-ejb-jar.xml
- /Web.war/WEB-INF
- weblogic.xml
weblogic-application.xml file, i.e.,in which we have defined a maximum thread constraint (limits the number of concurrent threads executing requests from the constrained work set), that we set equal to the used data source. We also set a minimum thread constraint, guarantees the number of threads the server will allocate to affected requests to avoid deadlocks. The default is zero. A minimum thread constraint value of one is useful, for example, for a replication update request, which is called synchronously from a peer. A minimum thread constraint might not necessarily increase a fair share. This type of constraint has an effect primarily when the server instance is close to a deadlock condition. In that case, the constraint will cause WebLogic Server to schedule a request even if requests in the service class have gotten more than its fair share recently.
- <?xml version='1.0' encoding='UTF-8'?>
- <weblogic-application xmlns="http://xmlns.oracle.com/weblogic/weblogic-application" xmlns:xsi="http://www.w3.org/2001/XMLSchema-instance" xsi:schemaLocation="http://xmlns.oracle.com/weblogic/weblogic-application http://xmlns.oracle.com/weblogic/weblogic-application/1.5/weblogic-application.xsd">
- <max-threads-constraint>
- <name>MaxThreadConstraint</name>
- <pool-name>DataSource</pool-name>
- </max-threads-constraint>
- <min-threads-constraint>
- <name>MinThreadConstraint</name>
- <count>1</count>
- </min-threads-constraint>
- <work-manager>
- <name>wm/DataSourceWorkManager</name>
- <min-threads-constraint-name>MinThreadConstraint</min-threads-constraint-name>
- <max-threads-constraint-name>MaxThreadConstraint</max-threads-constraint-name>
- <ignore-stuck-threads>true</ignore-stuck-threads>
- </work-manager>
- </weblogic-application>
Note that if we are dealing with a application that issues long lived (daemon) work, we can set
ignore-stuck-threads to true. In this case we will not a get warning when the thread runs longer than the configured max stuck thread time. One thing to note when issuing daemon work is the following note in the WorkManager doc: "If the scheduled Work is a daemon Work, then the life-cycle of that Work is tied to the application that scheduled it. If the application is stopped, the Work.release() method will be called." By default, the work manager associated with the application is the default work manager.A configuration that also includes a request class, and a capacity looks like
in which, we have defined a response time request class that specifies a response time goal in milliseconds. Note that response time goals are not applied to individual requests. Instead, WebLogic Server computes a tolerable waiting time for requests with that class by subtracting the observed average thread use time from the response time goal, and schedules requests so that the average wait for requests with the class is proportional to its tolerable waiting time. We also set a capacity. This causes the server to reject requests only when it has reached its capacity. The default is -1. Note that the capacity includes all requests, queued or executing, from the constrained work set. Work is rejected either when an individual capacity threshold is exceeded or if the global capacity is exceeded. This constraint is independent of the global queue threshold. Note that the capacity constraint is not enforced if the request is made by a user belonging to the WebLogic Server Administrators group. In the configuration above, we have also added stuck thread handling.
- <?xml version='1.0' encoding='UTF-8'?>
- <weblogic-application xmlns="http://xmlns.oracle.com/weblogic/weblogic-application" xmlns:xsi="http://www.w3.org/2001/XMLSchema-instance" xsi:schemaLocation="http://xmlns.oracle.com/weblogic/weblogic-application http://xmlns.oracle.com/weblogic/weblogic-application/1.5/weblogic-application.xsd">
- <response-time-request>
- <name>ResponseTimeRequest</name>
- <goal-ms>200</goal-ms>
- </response-time-request>
- <max-threads-constraint>
- <name>MaxThreadConstraint</name>
- <pool-name>DataSource</pool-name>
- </max-threads-constraint>
- <min-threads-constraint>
- <name>MinThreadConstraint</name>
- <count>1</count>
- </min-threads-constraint>
- <capacity>
- <name>Capacity</name>
- <count>200</count>
- </capacity>
- <work-manager>
- <name>wm/DataSourceWorkManager</name>
- <request-class-name>ResponseTimeRequest</request-class-name>
- <min-threads-constraint-name>MinThreadConstraint</min-threads-constraint-name>
- <max-threads-constraint-name>MaxThreadConstraint</max-threads-constraint-name>
- <capacity-name>Capacity</capacity-name>
- <work-manager-shutdown-trigger>
- <max-stuck-thread-time>600</max-stuck-thread-time>
- <stuck-thread-count>1</stuck-thread-count>
- </work-manager-shutdown-trigger>
- </work-manager>
- </weblogic-application>
To apply the above work manager to application components such as EJB's servlets, we can use the
dispatch-policy in weblogic-ejb-jar.xml and weblogic.xml, i.e.,Here, we have also set a transaction time-out for the EJB, just as an example (as the transactions are in the micro seconds range, so the 120 second time-out is far from necessary).
- # weblogic-ejb-jar.xml
- <?xml version='1.0' encoding='UTF-8'?>
- <weblogic-ejb-jar xmlns="http://xmlns.oracle.com/weblogic/weblogic-ejb-jar" xmlns:xsi="http://www.w3.org/2001/XMLSchema-instance" xsi:schemaLocation="http://xmlns.oracle.com/weblogic/weblogic-ejb-jar http://xmlns.oracle.com/weblogic/weblogic-ejb-jar/1.5/weblogic-ejb-jar.xsd">
- <weblogic-enterprise-bean>
- <ejb-name>Company</ejb-name>
- <transaction-descriptor>
- <trans-timeout-seconds>120</trans-timeout-seconds>
- </transaction-descriptor>
- <enable-call-by-reference>True</enable-call-by-reference>
- <dispatch-policy>wm/DataSourceWorkManager</dispatch-policy>
- </weblogic-enterprise-bean>
- </weblogic-ejb-jar>
- # weblogic.xml
- <?xml version='1.0' encoding='UTF-8'?>
- <weblogic-web-app xmlns="http://xmlns.oracle.com/weblogic/weblogic-web-app" xmlns:xsi="http://www.w3.org/2001/XMLSchema-instance" xsi:schemaLocation="http://xmlns.oracle.com/weblogic/weblogic-web-app http://xmlns.oracle.com/weblogic/weblogic-web-app/1.6/weblogic-web-app.xsd">
- <wl-dispatch-policy>wm/DataSourceWorkManager</wl-dispatch-policy>
- </weblogic-web-app>
Let us put some load on the environment
Pinned to thread on the JDBC data source
To minimize the time it takes for an application to reserve a database connection from a data source and to eliminate contention between threads for a database connection, we can set the pinned to thread option on the JDBC data source to true. When pinned to thread is enabled, WebLogic Server pins a database connection from the data source to an execution thread the first time an application uses the thread to reserve a connection. When the application finishes using the connection and callsconnection.close(), which otherwise returns the connection to the data source, WebLogic Server keeps the connection with the execute thread and does not return it to the data source. When an application subsequently requests a connection using the same execute thread, WebLogic Server provides the connection already reserved by the thread. There is no locking contention on the data source that occurs when multiple threads attempt to reserve a connection at the same time and there is no contention for threads that attempt to reserve the same connection from a limited number of database connections.Note that with pinned to thread the maximum capacity on the connection pool is ignored, i.e., the number of connections in a connection pool equals the greater of either the initial capacity or the number of connections reserved from the connection pool. Also the connection pool does not shrink as the connections are never returned to the connection pool.
With pinned to thread the number of connections in the connection pool is limited by the number of execute threads, which could get as high as 400 with the self tuning thread pool
- Self Tuning Thread Minimum Pool Size (sets the minimum thread pool size of the self-tuning thread pool - default 1). The self-tuning thread pool starts with the default size of 1. It grows and shrinks automatically as required. Setting this attribute changes the default min pool size. The thread count will never shrink below this value. It can add threads to improve throughput but will never decrease below the set minimum.
- Self Tuning Thread Maximum Pool Size (sets the maximum thread pool size of the self-tuning thread pool - default 400). The self-tuning thread pool starts with the default size of 1. It grows and shrinks automatically as required. Setting this attribute changes the default max pool size. The active thread count will never increase beyond this value. This value defines the maximum number of threads permitted in the server. Note that the server will add threads only if it improves throughput. Measurements are taken every 2 seconds and the decision to increase or decrease the thread count is based on the current throughput measurement versus past values.
The get information about the self tuning thread pool using WLST, we can use
- <?xml version='1.0' encoding='UTF-8'?>
- <weblogic-application xmlns="http://xmlns.oracle.com/weblogic/weblogic-application" xmlns:xsi="http://www.w3.org/2001/XMLSchema-instance" xsi:schemaLocation="http://xmlns.oracle.com/weblogic/weblogic-application http://xmlns.oracle.com/weblogic/weblogic-application/1.5/weblogic-application.xsd">
- <response-time-request>
- <name>ResponseTimeRequest</name>
- <goal-ms>200</goal-ms>
- </response-time-request>
- <max-threads-constraint>
- <name>MaxThreadConstraint</name>
- <count>16</count>
- </max-threads-constraint>
- <min-threads-constraint>
- <name>MinThreadConstraint</name>
- <count>1</count>
- </min-threads-constraint>
- <capacity>
- <name>Capacity</name>
- <count>200</count>
- </capacity>
- <work-manager>
- <name>wm/DataSourceWorkManager</name>
- <request-class-name>ResponseTimeRequest</request-class-name>
- <min-threads-constraint-name>MinThreadConstraint</min-threads-constraint-name>
- <max-threads-constraint-name>MaxThreadConstraint</max-threads-constraint-name>
- <capacity-name>Capacity</capacity-name>
- <work-manager-shutdown-trigger>
- <max-stuck-thread-time>600</max-stuck-thread-time>
- <stuck-thread-count>1</stuck-thread-count>
- </work-manager-shutdown-trigger>
- </work-manager>
- </weblogic-application>
in which we have used
- import os.path;
- print 'DEFINE VARIABLES FOR MONITORING';
- servers_to_monitor=['all']; # comma separated server names or 'all'
- print 'CREATE VARIABLES';
- domain_application_home = os.getenv('DOMAIN_APPLICATION_HOME');
- domain_configuration_home = os.getenv('DOMAIN_CONFIGURATION_HOME');
- domain_name = os.getenv('DOMAIN_NAME');
- fusion_middleware_home = os.getenv('FUSION_MIDDLEWARE_HOME');
- java_home = os.getenv('JAVA_HOME');
- middleware_home = os.getenv('MIDDLEWARE_HOME');
- node_manager_home = os.getenv('NODE_MANAGER_HOME');
- weblogic_home = os.getenv('WEBLOGIC_HOME');
- admin_server_url = 't3://' + admin_server_listen_address + ':' + admin_server_listen_port;
- admin_server_config_file = domain_configuration_home + '/admin_server_config_file.properties';
- admin_server_key_file = domain_configuration_home + '/admin_server_key_file.properties';
- def connect_to_admin_server():
- print 'CONNECT TO ADMIN SERVER';
- if os.path.isfile(admin_server_config_file) and os.path.isfile(admin_server_key_file):
- print '- USING CONFIG AND KEY FILE';
- connect(userConfigFile=admin_server_config_file, userKeyFile=admin_server_key_file, url=admin_server_url);
- else:
- print '-USING USERNAME AND PASSWORD';
- connect(admin_username, admin_password, admin_server_url);
- def get_server_runtimes(servers_to_monitor):
- print 'GET SERVER RUNTIMES';
- server_runtimes = [];
- servers = domainRuntimeService.getServerRuntimes();
- if 'all' in servers_to_monitor:
- for server in servers:
- if server.getName() != admin_server_name:
- server_runtimes.append(server);
- else:
- for server in servers:
- if server.getName() in servers_to_monitor:
- print 'Adding Server: ' + server.getName();
- server_runtimes.append(server);
- return server_runtimes;
- def get_self_tuning_configuration():
- servers = cmo.getServers();
- for server in servers:
- print server.getName() + ": " + repr(server.getAcceptBacklog()) + ", " + repr(server.getSelfTuningThreadPoolSizeMin()) + ", " + repr(server.getSelfTuningThreadPoolSizeMax()) + ", " + repr(server.isUseConcurrentQueueForRequestManager());
- def get_self_tuning_runtime(server_runtimes):
- for server_runtime in server_runtimes:
- print "name: " + server_runtime.getName();
- thread_pool_runtime = server_runtime.getThreadPoolRuntime();
- print "- health: " + repr(thread_pool_runtime.getHealthState());
- print "- mean number of requests completed per second: " + repr(thread_pool_runtime.getThroughput());
- print "- active threads: " + repr(thread_pool_runtime.getExecuteThreadTotalCount() - thread_pool_runtime.getStandbyThreadCount());
- print "- idle threads: " + repr(thread_pool_runtime.getExecuteThreadIdleCount());
- print "- standby threads: " + repr(thread_pool_runtime.getStandbyThreadCount());
- print "- number of pending user requests: " + repr(thread_pool_runtime.getPendingUserRequestCount());
- print "- hogging threads: " + repr(thread_pool_runtime.getHoggingThreadCount());
- print "- stuck threads: " + repr(thread_pool_runtime.getStuckThreadCount());
- active_threads = thread_pool_runtime.getExecuteThreadTotalCount() - thread_pool_runtime.getStandbyThreadCount();
- if active_threads > 0:
- execute_threads = thread_pool_runtime.getExecuteThreads();
- for execute_thread in execute_threads:
- if "ACTIVE" in execute_thread.getName():
- print "- ACTIVE THREAD: " + execute_thread.getName() + ", " + repr(execute_thread.getCurrentRequest()) + ", " + repr(execute_thread.getApplicationName()) + ", " + repr(execute_thread.getModuleName()) + ", " + repr(execute_thread.getWorkManagerName());
- if "STUCK" in execute_thread.getName():
- print "- STUCK THREAD: " + execute_thread.getName() + ", " + repr(execute_thread.getCurrentRequest()) + ", " + repr(execute_thread.getApplicationName()) + ", " + repr(execute_thread.getModuleName()) + ", " + repr(execute_thread.getWorkManagerName());
- connect_to_admin_server();
- server_runtimes = get_server_runtimes(servers_to_monitor);
- get_self_tuning_configuration();
- get_self_tuning_runtime(server_runtimes);
ThreadPoolRuntimeMBean and ExecuteThread to obtain runtime information regarding threads. Theweblogic.management.runtime package summary can be found here. Configuration information can be obtained from theweblogic.management.configuration package, such as the KernelMBean and ServerTemplateMBean.Let us run the load test again, to see what happens with the threads and the database connections. With the load test running, we can run the above WLST script to obtain information about the thread pool
In the WebLogic Admin Console (Server, Monitoring, Threads), we get information on the thread activity for the current server. The first table provides general information about the status of the thread pool. The second table provides information on individual threads.
- [weblogic@machine1 monitor]$ ./WorkManager.sh
- Java HotSpot(TM) 64-Bit Server VM warning: ignoring option MaxPermSize=256m; support was removed in 8.0
- Initializing WebLogic Scripting Tool (WLST) ...
- Welcome to WebLogic Server Administration Scripting Shell
- Type help() for help on available commands
- DEFINE VARIABLES FOR MONITORING
- CREATE VARIABLES
- CONNECT TO ADMIN SERVER
- -USING USERNAME AND PASSWORD
- Connecting to t3://machine1.com:7001 with userid weblogic ...
- Successfully connected to Admin Server "AdminServer" that belongs to domain "tryout_domain".
- Warning: An insecure protocol was used to connect to the
- server. To ensure on-the-wire security, the SSL port or
- Admin port should be used instead.
- GET SERVER RUNTIMES
- AdminServer: 300, 1, 400, 0
- server_1: 300, 1, 400, 0
- server_2: 300, 1, 400, 0
- name: server_2
- - health: Component:threadpool,State:HEALTH_OK,MBean:ThreadPoolRuntime,ReasonCode:[]
- - mean number of requests completed per second: 573.9910313901345
- - active threads: 4
- - idle threads: 0
- - standby threads: 3
- - number of pending user requests: 0
- - hogging threads: 0
- - stuck threads: 0
- - ACTIVE THREAD: [ACTIVE] ExecuteThread: '0' for queue: 'weblogic.kernel.Default (self-tuning)', 'Workmanager: wm/DataSourceWorkManager, Version: 793, Scheduled=true, Started=true, Started time: 0 ms\n', 'LoadTest6', '', 'wm/DataSourceWorkManager'
- - ACTIVE THREAD: [ACTIVE] ExecuteThread: '1' for queue: 'weblogic.kernel.Default (self-tuning)', 'Workmanager: wm/DataSourceWorkManager, Version: 2427, Scheduled=true, Started=true, Started time: 4 ms\n', 'LoadTest6', 'LoadTest6', 'wm/DataSourceWorkManager'
- - ACTIVE THREAD: [ACTIVE] ExecuteThread: '3' for queue: 'weblogic.kernel.Default (self-tuning)', 'javax.management.remote.rmi.RMIConnectionImpl', None, None, 'weblogic.admin.RMI'
- - ACTIVE THREAD: [ACTIVE] ExecuteThread: '5' for queue: 'weblogic.kernel.Default (self-tuning)', 'Workmanager: wm/DataSourceWorkManager, Version: 120, Scheduled=true, Started=true, Started time: 6 ms\n', 'LoadTest6', '', 'wm/DataSourceWorkManager'
- name: server_1
- - health: Component:threadpool,State:HEALTH_OK,MBean:ThreadPoolRuntime,ReasonCode:[]
- - mean number of requests completed per second: 601.25
- - active threads: 4
- - idle threads: 0
- - standby threads: 2
- - number of pending user requests: 0
- - hogging threads: 0
- - stuck threads: 0
- - ACTIVE THREAD: [ACTIVE] ExecuteThread: '0' for queue: 'weblogic.kernel.Default (self-tuning)', 'Workmanager: wm/DataSourceWorkManager, Version: 183, Scheduled=true, Started=true, Started time: 1 ms\n', 'LoadTest6', '', 'wm/DataSourceWorkManager'
- - ACTIVE THREAD: [ACTIVE] ExecuteThread: '3' for queue: 'weblogic.kernel.Default (self-tuning)', None, None, None, ''
- - ACTIVE THREAD: [ACTIVE] ExecuteThread: '4' for queue: 'weblogic.kernel.Default (self-tuning)', 'Workmanager: wm/DataSourceWorkManager, Version: 1398, Scheduled=true, Started=true, Started time: 14 ms\n', 'LoadTest6', '', 'wm/DataSourceWorkManager'
- - ACTIVE THREAD: [ACTIVE] ExecuteThread: '5' for queue: 'weblogic.kernel.Default (self-tuning)', 'Workmanager: wm/DataSourceWorkManager, Version: 1092, Scheduled=true, Started=true, Started time: 4 ms\n', 'LoadTest6', '', 'wm/DataSourceWorkManager'
To see if it does make a difference in performance when pinned to thread is enabled, we take a look at some flight recording results. Individual (servlet, EJB, JDBC) execution times, can be obtained from the events, graph tab (top: pinned to thread disabled, bottom: pinned to thread enabled).


Comments
Post a Comment